
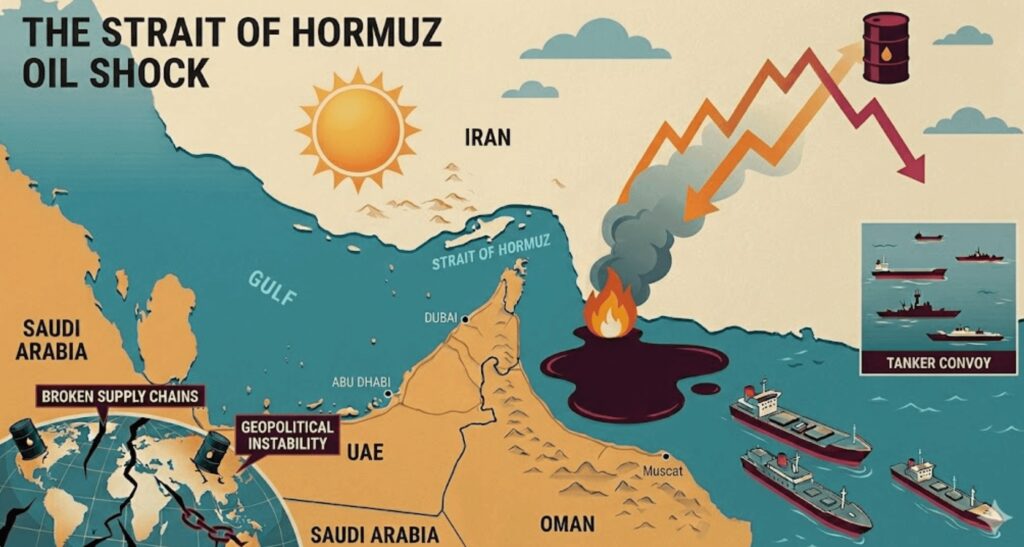
On February 28, 2026, coordinated airstrikes led by the US-Israel coalition targeted Iranian military targets. Immediately, Iran’s Islamic regime chose to destabilize international trade through a single maneuver: the closure of the Strait of Hormuz. This 55-kilometer-wide passage is one of the world’s most critical energy arteries, through which approximately 20% of seaborne oil and liquefied natural gas (LNG) transit. The International Energy Agency (IEA) has described this situation as the “largest supply disruption in the history of the global oil market.”
This crisis differs from previous oil shocks both in its scale and in its context. Iran did not resort to a naval blockade or the use of anti-ship missiles. Low-cost drone strikes on commercial vessels were enough to make the entire passage uninsurable. As a result, shipping companies stopped transiting on their own.
The closure of the strait triggered an immediate market reaction. Yet the current volatility in equity markets follows a pattern found in most major energy supply disruptions of the past half-century. This article seeks to compile what historical data tells us, and how the current crisis compares.
The Oil Price Surge
Data from the EIA (Energy Information Administration) illustrates the brutal market reaction to this geopolitical crisis. Brent crude oil, which started 2026 at $61 per barrel, ended at $118 on March 31, highlighting a 63% increase in Q1 2026. In real inflation-adjusted terms, this represents the sharpest quarterly spike since EIA records began in 1988.
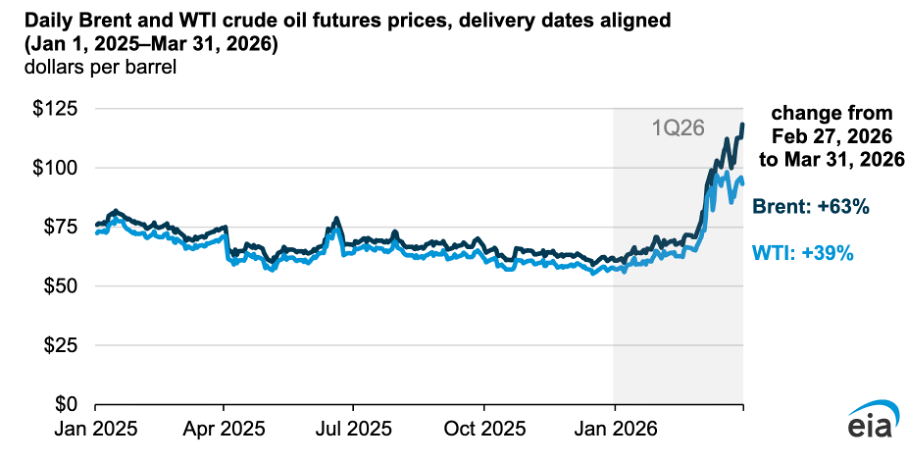
Daily Brent and WTI Crude Oil Futures Prices (Jan. 2025 to March 2026) Source : EIA
The economic fallout is already measurable. The Dallas Federal Reserve estimates that a full quarter of closure would reduce global real GDP growth by 2.9%. Meanwhile, Goldman Sachs has raised the probability of a U.S. recession to 25%, noting that oil prices now carry a “geopolitical risk premium” of at least $14 per barrel, reflecting a market actively reassessing the global economic outlook.
Beyond Crude Oil: A Broader Supply Shock
The Strait of Hormuz is not only a passage for crude oil. It is also a critical bottleneck for liquefied natural gas. According to the IEA, nearly 93% of Qatar’s and 96% of the UAE’s LNG exports pass through this passage. Euronews highlights that roughly one-third of global fertilizer trade also transits through the strait. The closure has driven urea prices up by 50%, just as the Northern Hemisphere enters the planting season. What started as an energy shock is thus expanding into a food inflation problem driven by declining fertilizer exports.
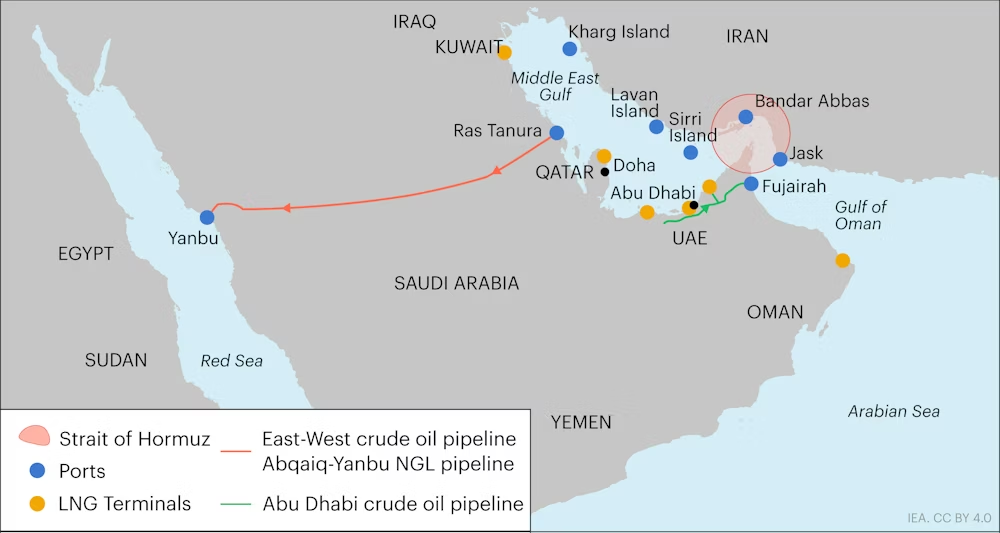
Crude oil and LNG landscape in Middle-East Source : IEA
As we explored in our latest article on energy networks and Europe’s gas crisis, Europe’s post-Ukraine diversification RePowerEU, reduced its dependence on Russian pipeline gas but increased exposure to global LNG price shocks.
Equity Markets: A Repeating Pattern
Equity Markets: A Repeating Pattern
The link between oil supply shocks and equity market declines is well-documented in the literature. Economists like James Hamilton (Historical Oil Shocks, Feb. 2011) have shown that since World War II, almost every major U.S. recession was preceded by a surge in oil prices. But why exactly do equities fall when oil surges?
The current turbulence is a direct manifestation of the stagflation trap. When energy prices climb, inflation becomes structural rather than transitory. Rising crude costs ripple through every link of the supply chain, from logistics to industrial production. This acts as an “invisible tax” on the private sector, reducing consumer purchasing power and weakening demand. At the same time, corporate margins compress as production costs rise while the economic backdrop hardens. This situation puts central banks in a dilemma. They cannot cut rates to support growth because inflation is accelerating. But raising them also risks worsening the economic slowdown. As a result, markets correct downward because there is no adequate policy response. Earnings expectations and interest rate uncertainty work against equities at the same time.
This mechanism is confirmed by historical data. During the four oil-linked recessions, the S&P 500 recorded average declines ranging from 20% (1991) to 48% (1973). The 2026 reaction appears to be following this same historical pattern.
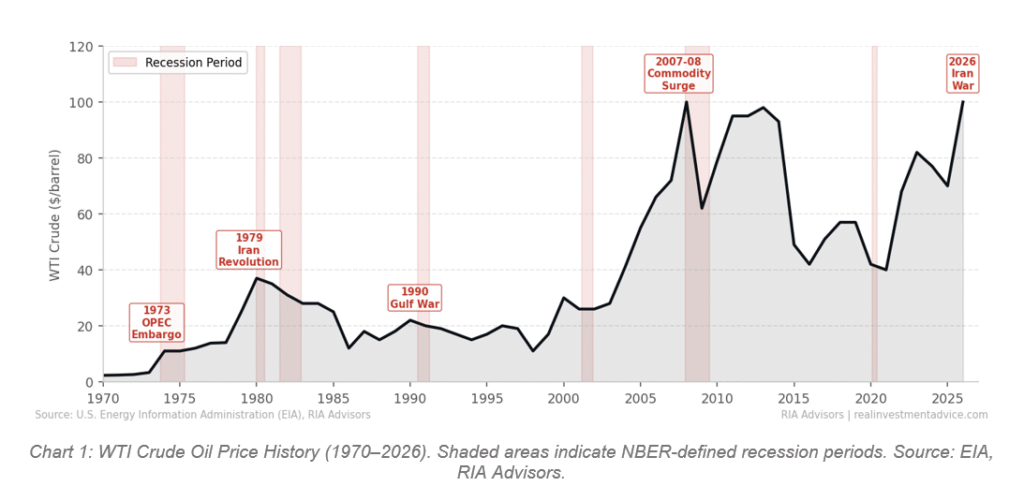
Oil Prices (WTI) and USA Recessions (1970-2026) Source : Real Investment Advice
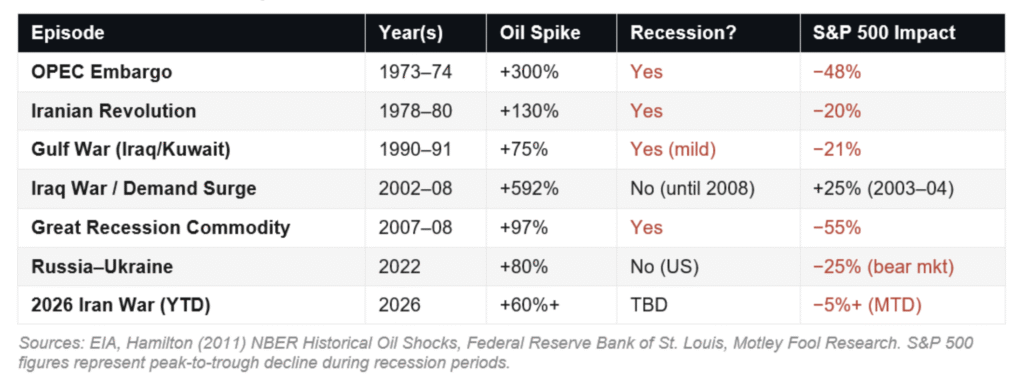
Historical Oil Shock and S&P500 Impact Source : Real Investment Advice
2026 Market Performance
Since the start of the year, the S&P 500 has retreated roughly 10% from its all-time high in January. The Nasdaq Composite has also declined more sharply, with a 12% correction. In the bond market, the 10-year Treasury yield reached 4.48% on March 27, its highest level since July 2025, as investors price in higher inflation. The OECD has already revised its U.S. inflation forecast upward to 4.2% for 2026, well above the Federal Reserve’s own 2.7% projection.
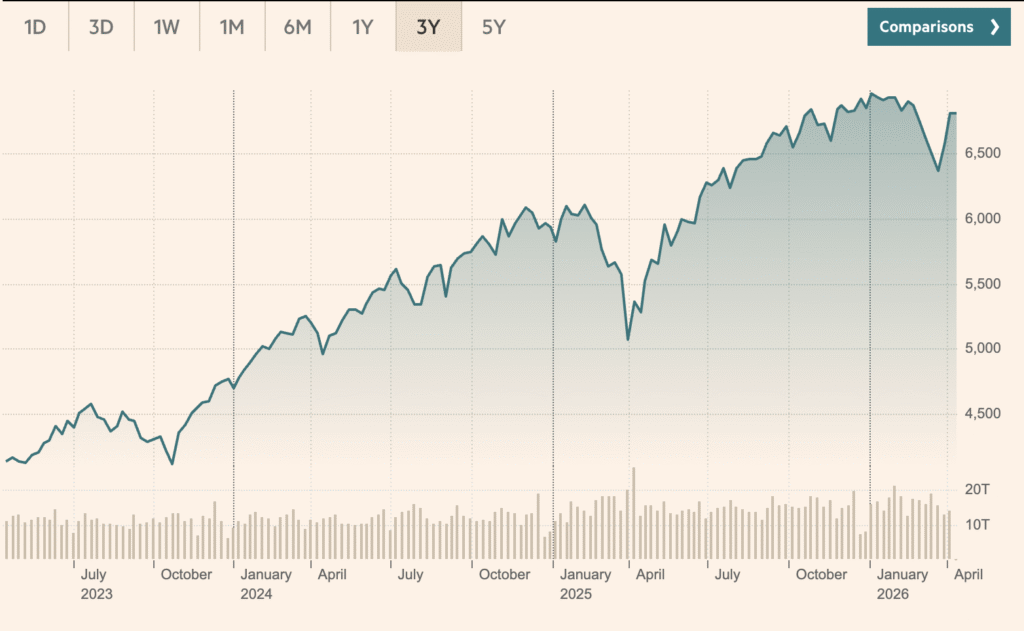
S&P 500 Performance: 3-Year Historical View (2023–2026) Source: Financial Times
As one might expect, the impact varies across sectors. The Oil & Gas ETF (XOP) has gained nearly 30% year-to-date following the surge in energy prices. Airlines and industrial stocks have been hit hard, with fuel costs significantly impacting their margins. During oil crises, energy-producing companies benefit and see their stock prices rise, while those that consume energy pay the price.
Forward Guidance
The 2026 crisis confirms what tools like the Caldara & Iacoviello Geopolitical Risk Index have long suggested: geopolitical risk spikes correlate with equity market declines and they can be anticipated. BlackRock’s Geopolitical Risk Indicator and a surge in war-risk insurance premiums had both flagged elevated risk levels weeks before the first strikes. The signals were there but remain complex to interpret during periods of heightened uncertainty.
What comes next depends above all on one variable: the duration of the blockage of the Strait of Hormuz. The EIA’s current forecast, with a peak at $115 per barrel in Q2, assumes that maritime traffic gradually resumes in April. If no agreement is reached allowing the reopening of the strait, the risk premium currently priced into the markets may only be an aperitivo.
April 13th, 2026
You may also enjoy reading…